 In our most recent webinar, we took a look at Business Intelligence with Microsoft Dynamics GP. In this webinar, we covered how business intelligence can be used with Microsoft Dynamics GP. If you want to catch up on this, or any other, webinar, you can do so here.
- Introduction
- What is Business Intelligence?
- What is Jet Analytics?
- Reporting options with Jet Analytics
- What is Power BI?
- Reporting options with Power BI
- Conclusion
Introduction ^
I think this webinar was the first one in which we didn’t even open Microsoft Dynamics GP. This because this webinar focused on how business intelligence can be used with Microsoft Dynamics GP. We focused on two business intelligence products which can be used to quickly build required dashboards and reporting for business intelligence.
The two products we looked at are complimentary and can be used both together or independently. They are Jet Analytics and PowerBI
What is Business Intelligence? ^
Before getting to the main part of the topic I thought it was worth clarifying exactly what business intelligence is and how it differs from reporting as I’ve seen a number of different definitions.
Reporting is pulling facts from a database to show you what has happened so far and what the status of that thing is, often using standard/pre-built formats to present the data in different ways; business intelligence shows you why things happened and how this can be used to improve business performance in the future. Business intelligence often uses multiple sources of data.
What is Jet Analytics? ^
Jet Analytics from insightsoftware allows for easy, quick self-service analytics and reporting, business users can manage and create the reports they need, without relying on IT to prepare their data. The user-friendly drag-and-drop interfaces simplify data management and report creation and do not require users to type code. The key features are:
- Data warehouse automation for fast, consistent, business analytics and master data management.
- Rapid deployment and eliminate any need to understand the underlying data structure.
- Provides accurate, governed data for one version of the truth.
- Rapid time-to-value through turnkey installation in hours.
- Pre-built OLAP cubes, a data warehouse, and dashboards.
- Low cost of ownership — includes a drag-and-drop customisation platform.
When Jet Analytics is purchases, Jet Reports is also supplied; this is the reporting solution from insightsoftware which can be used to report direct fro Microsoft Dynamics GP, from the data warehouse or from the OLAP cubes.
Reporting options with Jet Analytics ^
Jet Analytics can be used to pull together information from several different data sources, including, but not limited to, data from Microsoft Dynamics GP, Dynamics CRM or a legacy SQL database. The Jet Data Manager allows you to build the staging database and data warehouse structures for the data. If using Microsoft Dynamics GP, then there is a default project from insightsoftware which you can implement and which contains the setup for reporting from the financial and distribution modules.
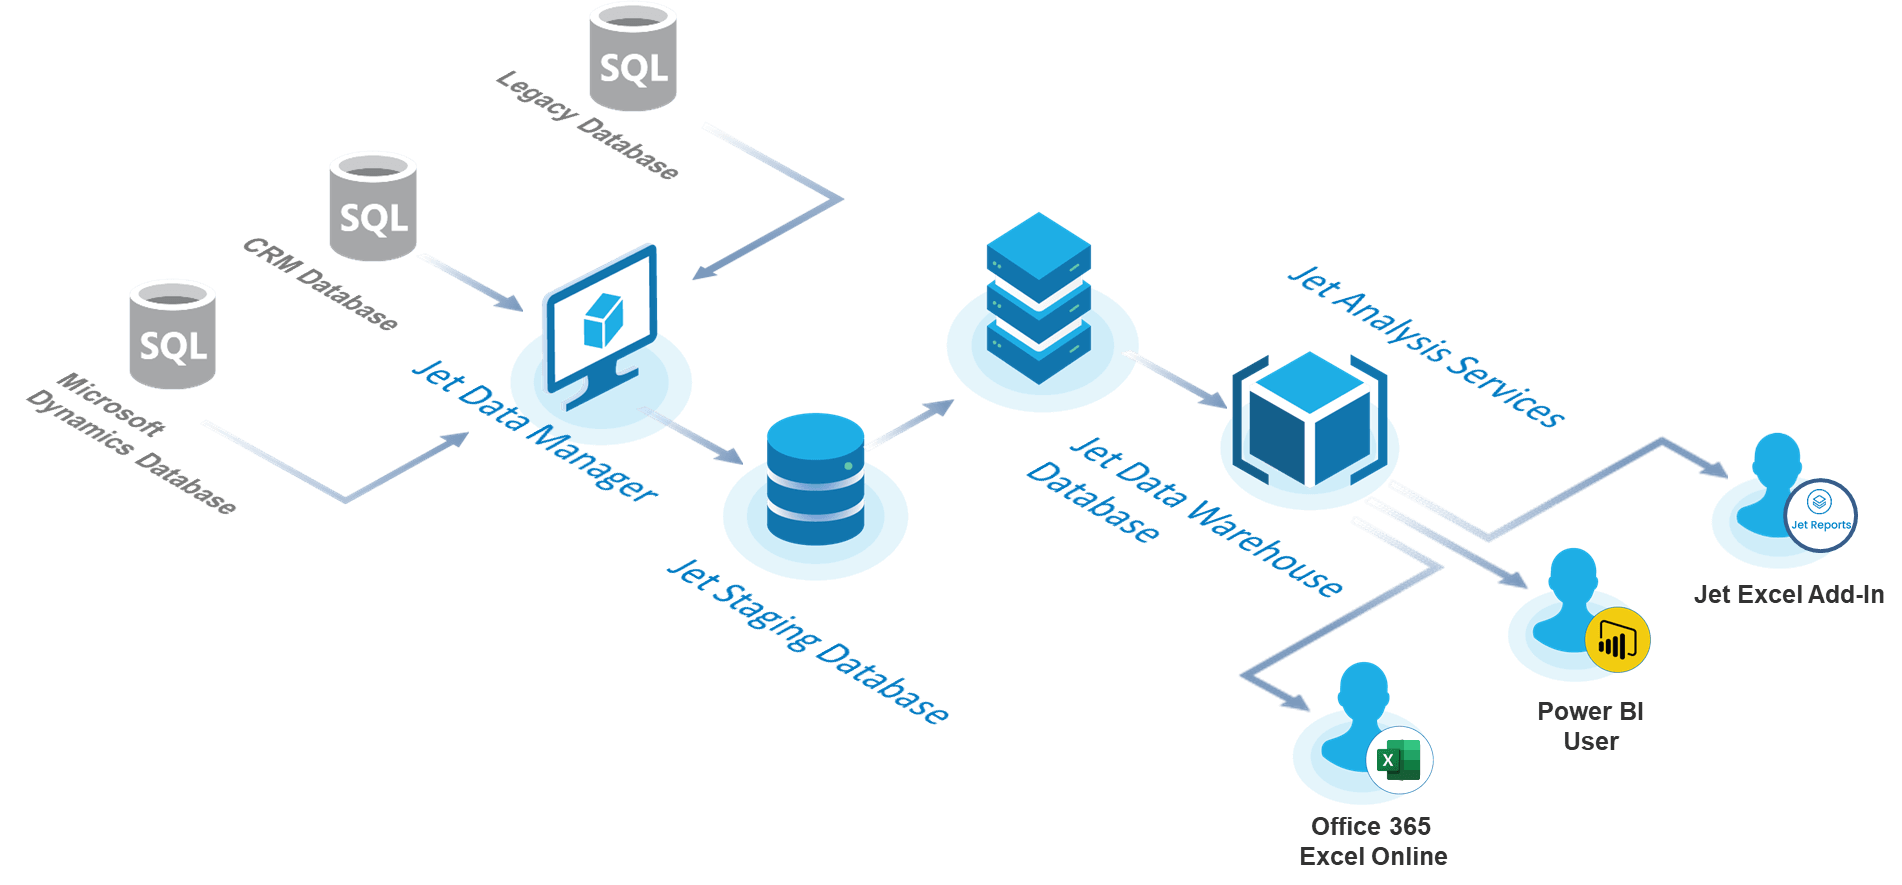
Once the data warehouse and cubes have been defined, the processed data can be reported upon using lots of different reporting and business intelligence tools, such as Jet Reports and Power BI. Other tools such as Qlik, Tableau or similar tools can also be used.
Jet Reports Excel Addin ^
Jet Reports comes with Jet Analytics or can be purchased as a standalone products. Jet Reports gives you all of your Financial and Operational reporting inside Excel with the click of a button:
- Cut reporting time and costs.
- Real-time reporting.
- Financial and operational reporting in a familiar environment.
- Self-serve financial and operation reporting.
- Reports available to users via a secure and easy to use portal.
- Many plug-and-play sample reports to get you started (across the financial and distribution modules).
- Supports consolidated reporting from any Dynamics GP companies.
- Output formatted financial reports to Microsoft Word.
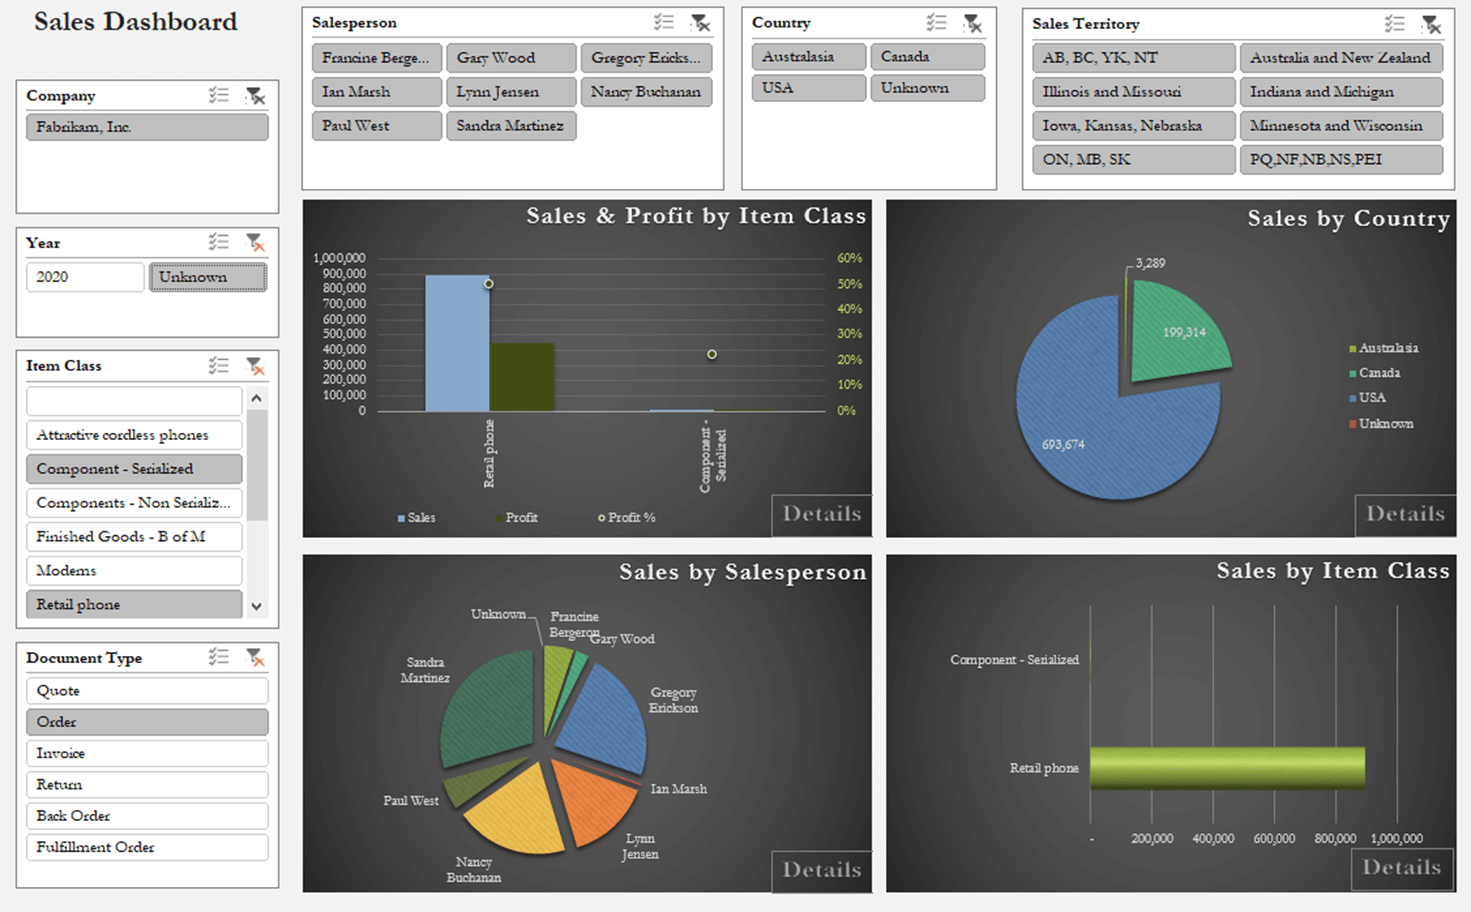
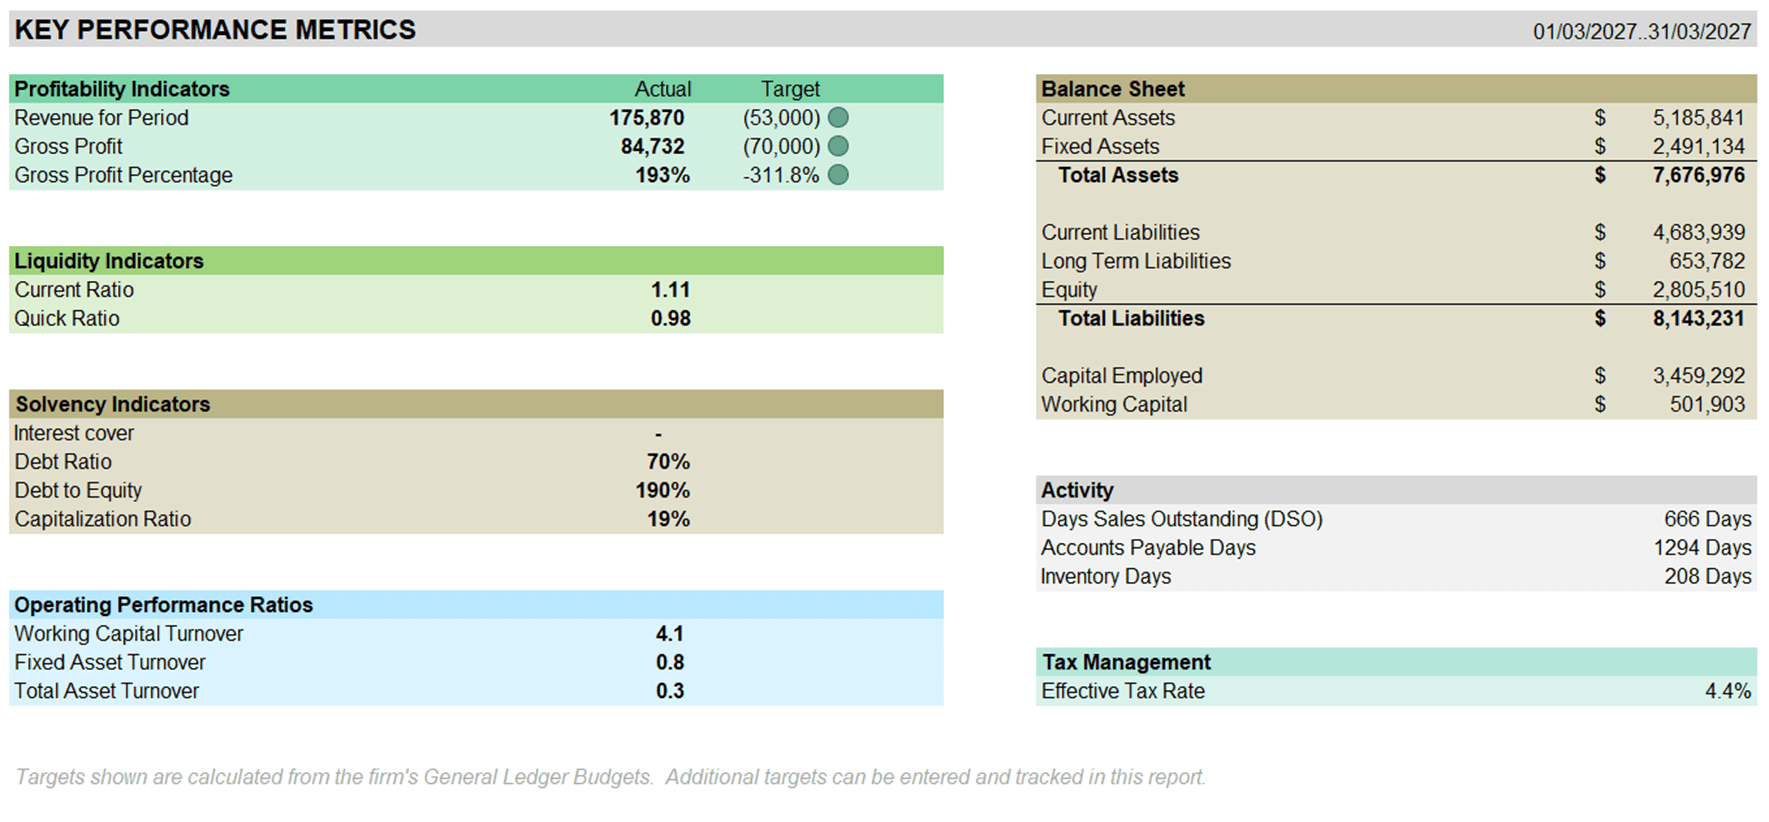
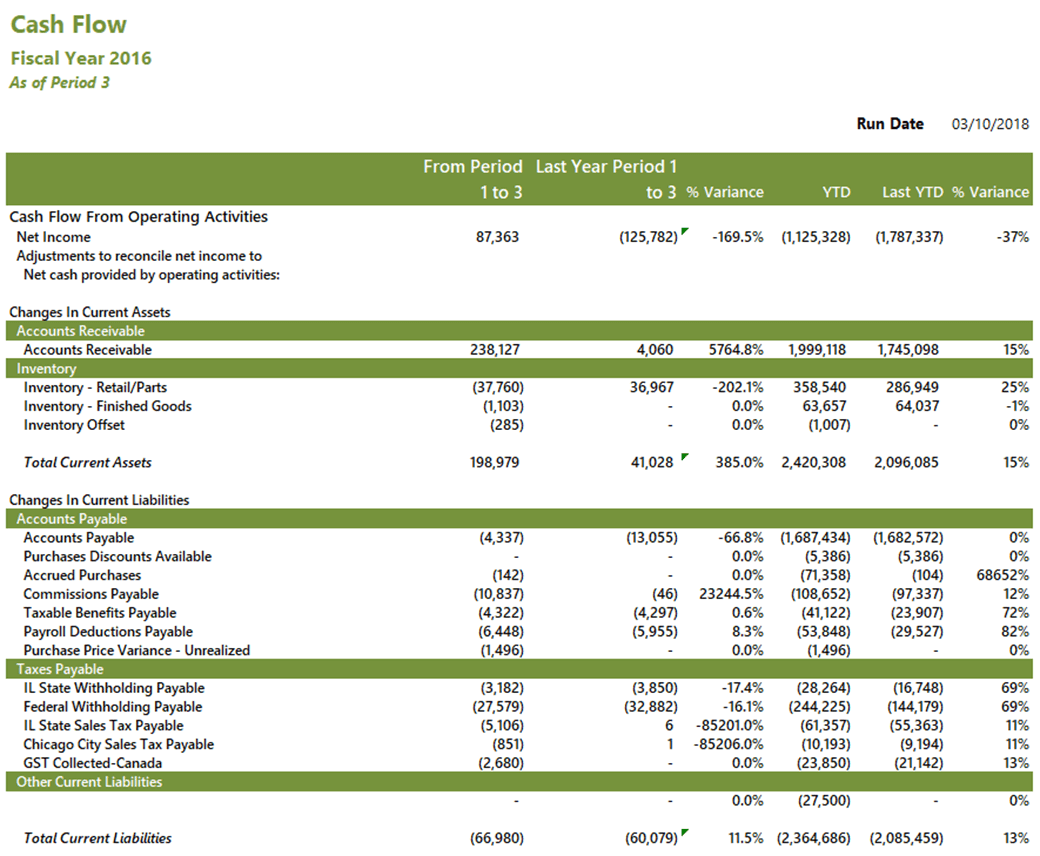
You can use Jet Reports to build reports using the data warehouse or OLAP cubes to build dashboards and reports:
What is Power BI? ^
Power BI is a business analytics service by Microsoft which aims to provide interactive visualizations and business intelligence capabilities with an interface simple enough for end users to create their own reports and dashboards.
It can be connected to Dynamics Go using the OData service or through a third party data warehouse or OLAP cubes such as those provided by Jet Analytics.
Reporting options with Power BI ^
In this part of the webinar we covered a number of scenarios beginning with building an initial report in Power BI Desktop. This is a great way to start working In your Power BI Project.
Power BI Desktop is available FREE from the Microsoft Store and can be used to build reports that can be run in Power BI Desktop or published to Power BI Pro:
Once you are happy with your report you can publish to the Power BI Pro service in Office 365, this is used to create Dashboards and share with colleagues. Power BI Pro is currently available at $9.99 or is included in the Microsoft 365 E5 subscription. Check current pricing here.
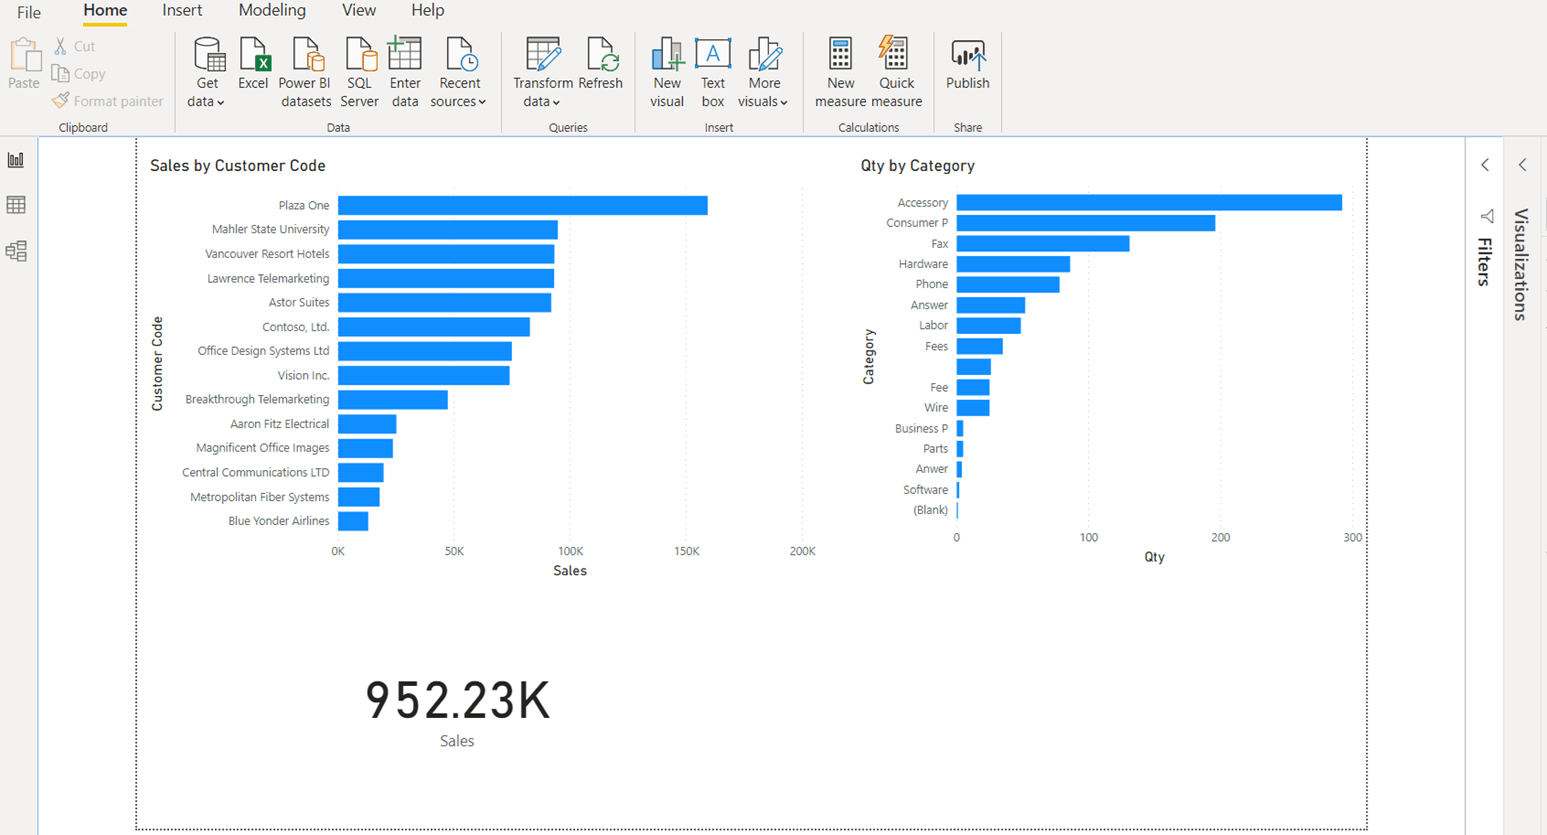
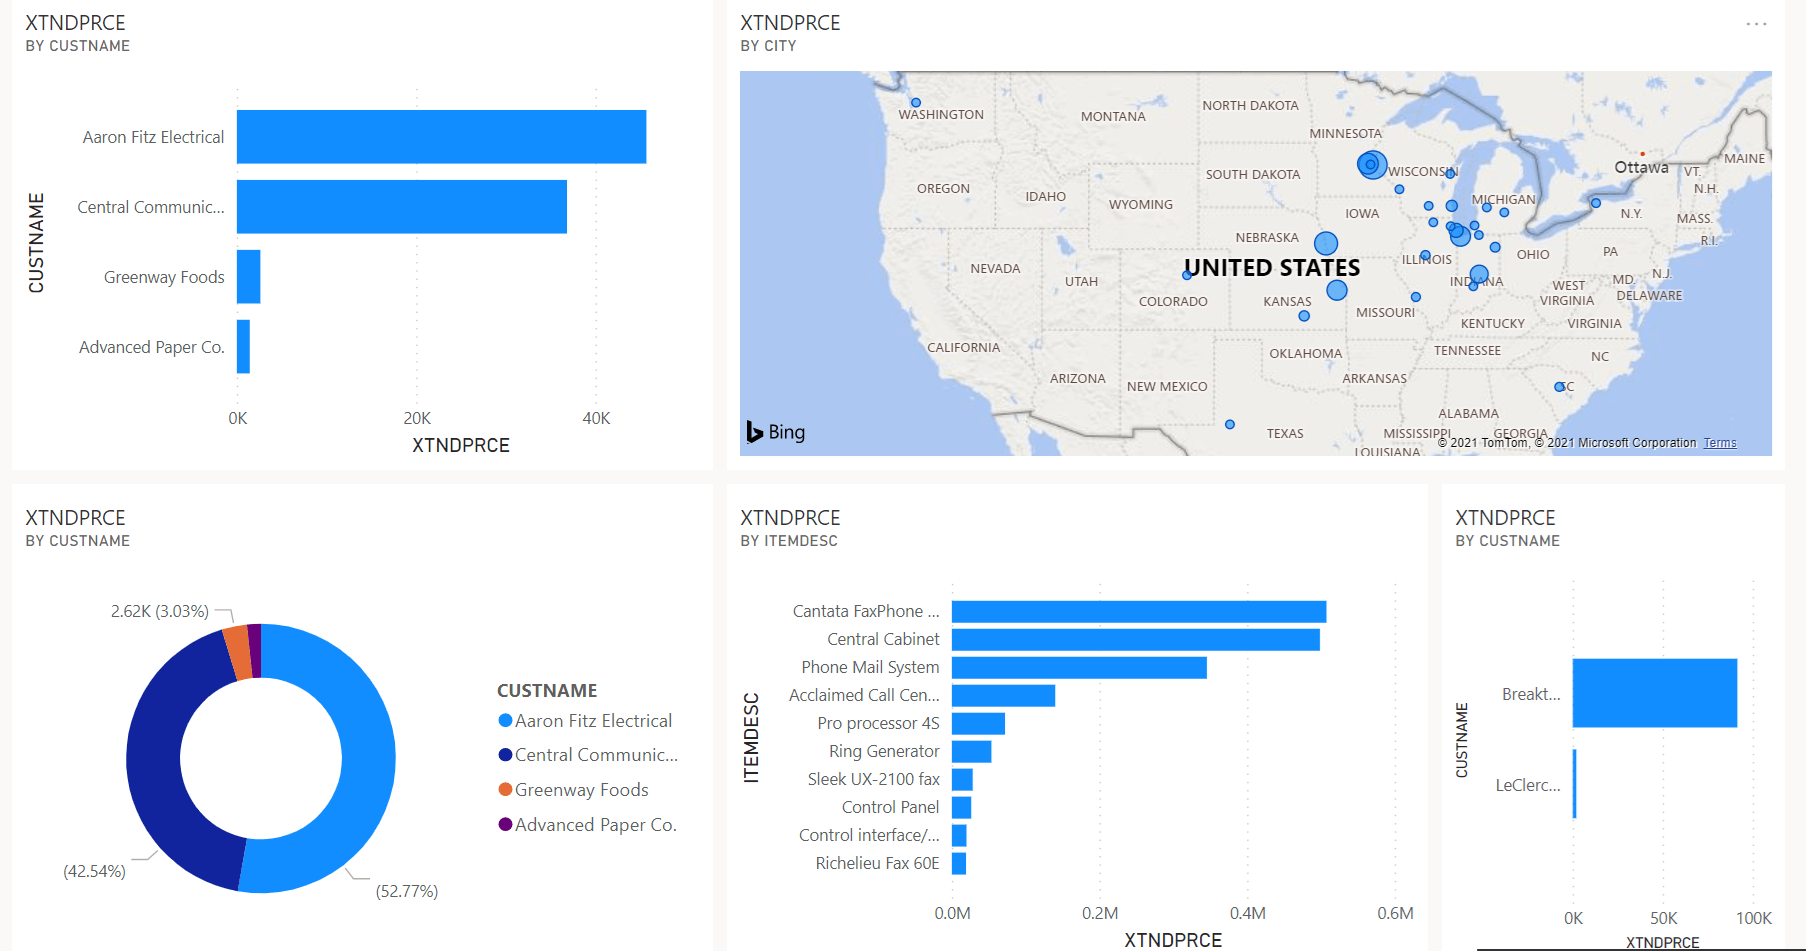
Dashboards
Dashboards in Power BI pro can be used to create a range of individual data visualisations:
Power BI Q&A
Ask natural language questions to query your data and build reusable dashboard tiles:
Manage Alerts
Create Alerts when your metrics reach specific conditions:

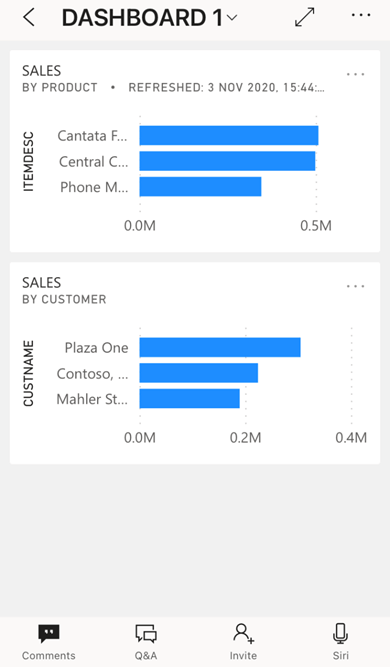
Power BI Mobile
Securely access and view live Power BI dashboards and reports on any device, with native mobile BI apps for Windows, iOS, and Android.
Conclusion ^
Business intelligence can allow you to extend the capabilities of your system beyond simple reporting by giving you access to the tools required to build the dashboards and analytics which allow you to extend to predictions and forecasting. Traditionally business intelligence has not been cheap, but tools like Jet Analytics and Power BI can bring down the cost of implementation and dashboard/report building through how ways they are to use; especially when factoring in that neither of them requires a developer.
Power BI can be used as a standalone system connected directly to a SQL database or using an OData service to connect with Microsoft Dynamics GP (this latter is the recommended way for better security. The OData service comes as standard with Dynamics GP. It is a very flexible and easy system to use and allows you to use your data in visualisations and some of the natural language queries which are possible makes it very quick and easy to get information (such as on the top 10 customers which is something for which I am regularly asked.
The main stumbling point for this is often how data joins together; this is where something like Jet Analytics can save you a lot of time as the data warehouse and OLAP cubes it ships with are already structured to bring connected data together.
What should we write about next?
If there is a topic which fits the typical ones of this site, which you would like to see me write about, please use the form, below, to submit your idea.

