 This post is part of the New Functionality In Microsoft Dynamics 365 Business Central 2023 Wave 2 series in which I am taking a look at the new functionality introduced in Microsoft Dynamics 365 Business Central 2023 Wave 2.
The third of the new functionality in the Reporting and data analysis section is Analyze, group, and pivot data on lists.
End users and data analysts can analyze data from lists directly in the client without the need to open the page in Excel or run a report.
The ability to analyze data directly in lists raises the bar for what you can do without having to switch applications, while still allowing customers and partners to do more in report objects, Excel, Power BI, or other data analysis applications.
Enabled for:
Public Preview: –
General Availability: Oct 2023
Feature Details
Analysis mode is a new way of interacting with data on lists. Instead of running reports using different options and filters, you can simply add multiple tabs that represent different tasks or views on the data. Examples could be "My customers," "Follow-up items," "Recently added vendors," "Sales statistics," or any other view you want.
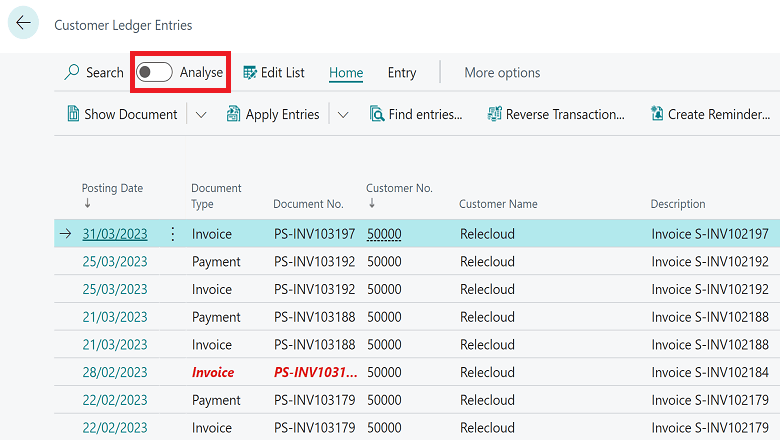
When you’re ready to analyze data on a list page (where you might have filtered data using a view or filter pane), simply switch to analysis mode:
Analysis mode opens the data in a new experience that’s optimized for data analysis. When a page is in analysis mode, it’s split into two areas:
- The main data area (including a Tabs pane)
- The field modifier area
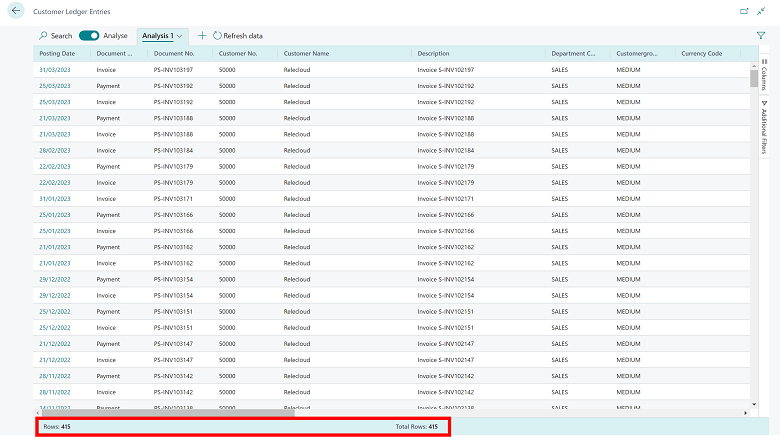
Use the data area to interact with the data. For columns that are summable, you can easily get descriptive statistics on a set of fields by marking them.
The bottom of the data area shows the total row count on the column.
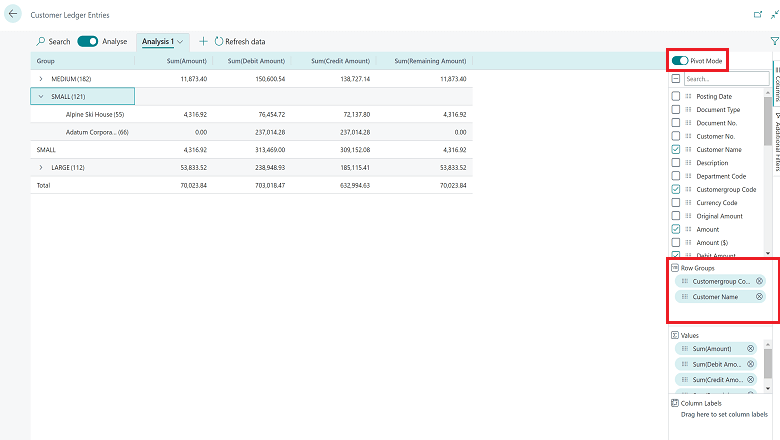
Use the field modifier area to control the data to show and its format. On the menu, you choose the fields to show or hide.
You can group data by dragging fields to the Grouping part of the Columns menu. This lets you explore data grouped by one or more fields to the left of the data area.
Grouping works great in pivot mode. To enable pivot mode, turn on the Pivot Mode toggle switch and then drag fields that are to be summed to the Values part.
In pivot mode, you can define groups that show up in the column part of the data area. Do this by dragging fields to the Column Labels part of the Columns menu.
Column grouping works best if the grouping field only contains a few values.
Use the Additional Filters menu of the field modifier area to apply more filters to the dataset. In this part of an analysis, you might want to focus on a specific customer or period of time.
The data area gives you rich control of the layout of columns.
- Drag columns to where they make the most sense in your analysis.
- Pin a column to the left or right side of the column part.
- Define data filters directly on the column definition instead of going to the field modifier area. You can still peek in on details about related data and for each line, and open the card to learn more about a given entity.
Business Central can save multiple column setups and filters. The next time you switch to analysis mode you can dive straight in to analyzing data. On the Tabs pane, you can rename or remove a tab.
The Tabs pane also lets you add new tabs.
Using tabs allows you to save different setups that you frequently use to analyze a dataset. For example, you might have tabs for analyzing data with pivot mode, and other tabs that filter to a subset of rows. Some tabs might show a detailed view with many columns, and others only display a few key columns.
 Note
Note
These tabs are saved for your use only.
How much data can I analyze?
On a list page, as a starting point you can set filters to limit the data. Maybe you want to analyze a certain group of customers, or maybe you want data from the current year only. You can also choose a page view to perform this action. You don’t have to do this prefiltering step, but going to analysis mode will load all data into your browser, so it might be needed for larger datasets (currently above 100,000 rows).
In the 2023 release wave 2, Microsoft allow users to analyze more data than 100,000 rows.
How do I get started with analysis mode?
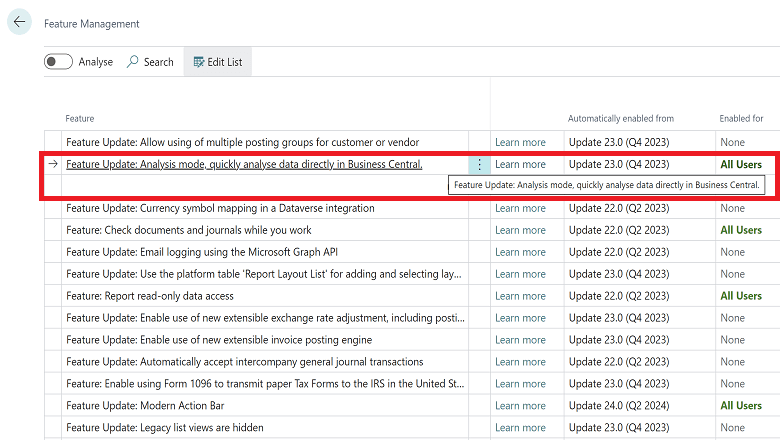
The feature is turned on by default. Your administrator can turn it off using the Feature Management page by disabling Analysis mode.
What Microsoft changed based on feedback from the public preview
- Added the ability to control on which list pages the analysis mode is enabled.
- Added the ability to share an analysis mode tab with a co-worker.
- Increased the data set size to above 100,000 rows.
- Added persistence for the user’s choice of analysis mode on list pages, so that their preferences are remembered from their last visit.
| New Functionality In Microsoft Dynamics 365 Business Central 2023 Wave 2 |
| Change Modification Limits for Triggering Flows and Bulk Updates |
| Support Business Events in Business Central Connector for Power Automate |
| Enable Specific Virtual Tables When You Connect to Dataverse |
| Get Control Over How to View Power BI Embedded Content |
| Availability Overview Helps You Calculate Quantities in Your Warehouse |
| Configure The Right Level of Handling For Different Warehouse Operations |
| Do financial Consolidations Across Environments in Multicompany Setups |
| Edit in Excel on Item Journals and Warehouse Worksheets |
| Get More Productive While Approving Time Sheets |
| Get More Productive While Entering Time Sheets |
| Include Approvals for Intercompany General Journals in Your Workflows |
| Make Intercompany Transactions Across Business Central Environments |
| Suggest the Next Step For Sales and Production Orders |
| Sync Document and Posting Dates for Sales and Purchases |
| Troubleshoot Shopify Integration Issues |
| Usability Improves for Warehouse, Inventory, and Tracking |
| Use Directed Pick and Put-away Suggestions in Basic Warehouse Configurations |
| Use General Ledger Allocations to Distribute Costs and Revenue More Efficiently |
| Complete Bank Account Reconciliation Faster With Copilot |
| Get Marketing Text Suggestions with Copilot |
| New Design for Report Language and Region Settings |
| Advance Payment and a Posting Preview of Tax Documents – Czechia |
| Direct Transfer – Czechia |
| E-submission of VAT Return in Denmark |
| Iceland Localization App – Delocalization |
| Intercompany Posting Cues to the Accountant Role Center – Czechia |
| New Intrastat – Czechia |
| Registration and Notification Functionality for Denmark |
| E-invoicing with NemHandel in Denmark |
| Supporting More Countries and Regions |
| Open Visual Studio Code From Web Client to Investigate or Troubleshoot Extensions |
| Turn Off Data Analysis Mode on Pages and Queries |
| Turn Off Indexes as a Partner |
| Use the Built-in Rich Text Editor to Enter Data |
| Assign More Granular Administration Rights |
| Improved Update Release Processes |
| Cancel Cloud Migration Replication Runs |
| Digital Vouchers |
| E-documents Core as a Global Solution |
| Large Companies to Report Payment Times |
| Modify Texts on the Welcome Banner and Skip Banner Intro State |
| Set Initial Role Before First Sign-in for a Better First-Run Experience |
| Enhancements to Excel Add-in |
| Analyze, Group, and Pivot Data on Queries Using Multiple Tabs |
| Discover Report and Data Analysis Content Easily |
| Get Power BI Reports for Reporting and Data Analysis on Finance, Sales, and Inventory |
| Data Loads Faster in the Server |
| Faster Application Scenarios |
| Pages Load Faster in Client |
| Performance Gain Reducing Locks in the Database |
| Add Existing Table Fields to Optimize Your Pages |
| Get to Data Search From Anywhere in Business Central |
| Distinguish Browser Tabs When Multitasking |
| Share Readable Deep Links to Pages and Records |
| Manage User Expectations with Selection Context-Based Actions |
| Peek at Summarized Data From Editable Fields |
| Search for Pages and Data in the Mobile App |
| Use Actions to Navigate or Fix Errors From Inline Validation Dialog |
| Updates to the Release Plan |
| Power Pages Support via Business Central Virtual Tables on Dataverse |
| Synchronize More Fields in Your Integration with Dataverse and Dynamics 365 Sales |
| Consolidated Power Automate Flow Creation from Business Central Templates |
| Get List of Companies Using Business Central Connector in Power Automate |
| Simplified Power Automate Approval Flow Experience |
| Create Power Automate Flows that Dynamically Support Different Companies |
| Business Central Virtual Tables Fully Supported on Microsoft Dataverse |
| Relate Native and Virtual Tables to Expose More Business Central Data in Dataverse |
| Include Only Open Entries on Customer Statements |
| Adjust Exchange Rates Easily, Replace the Built-in Batch Job |
| More Control Over General Journal Approvals |
| Use Different General Ledger Accounts for Payables, Receivables |
| Add More Columns to Pages for Better Insight |
| Availability Overview Helps You Calculate Quantities in Your Warehouse |
| Block Item Variants |
| Identify and Track Items Easier with Item References |
| Improved Processes for Inventory Counts and Adjustments |
| Navigate Easier Between Order, Receipt, and Invoice Documents |
| Print and Scan Barcodes |
| Receive More Items Than Ordered by Using Inventory Put-away Documents |
| Generate a Customer Statement Only With Open Entries |
| Responsibility Centers Are Supported for Advance Payments in Czechia |
| Easier Management of System Application Permissions |
| Get the AL Language Extension in Prerelease Versions on Visual Studio Code Marketplace |
| Find All References Now Works on Triggers, System Methods, and Trigger Events |
| Get Inlay Hints in Source Editor for AL Method Parameters and Return Types |
| Get Inlay Hints in Source Editor for AL Method Parameters and Return Types |
| Hover Over Label Variable to See Text String Value |
| Set New Output Folder Setting for Storing App Files at AL Project Build |
| Choose Between More Sampling Intervals for Snapshot and In-client Profiling |
| Get IntelliSense for Adding Variables in Visual Studio Code AL Debugger Console |
| Get Smarter Method Signature Recommendations in IntelliSense |
| Set the Default Folder Location for New AL Projects |
| Track Source and Build Metadata on Extensions |
| Use SecretText Type to Protect Credentials and Sensitive Textual Values From Being Revealed |
| Document Your Extensions With the ALDoc Tool for Partners |
| Segment AL Code and Reduce Naming Conflicts with Namespaces |
| Show List of Keys While Working on AL Code |
| Use the AL Language Extension for Linux in Preview |
| Provide Queries for Users to do Ad Hoc Data Analysis Across Tables |
| Add a New FieldGroup to an Existing Table |
| Add Teaching Tooltips on Queries and Report Request Pages |
| Get Syntax Highlighting for AL in Azure DevOps |
| Sell Business Central Apps Through AppSource |
| AppSource ISV Publishers Can Preview Their AppSource Apps With Select Customers |
| Extend General Ledger Posting Aggregations |
| Define multi-worksheet datasets for Excel reports |
| Include or Exclude Tables From Cloud Migration |
| Delete Data from Uninstalled Extensions as an Admin |
| Automatically Update AppSource Apps With Minor Updates |
| Transfer Environments Between Microsoft Entra Tenants |
| Control Partner Access Per Environment |
| Use Drop Shipments for Triangular Intrastat Trade |
| Start Faster with Refreshed and Enhanced Setup Data |
| VAT Posting in General Ledger Setup |
| Demo Tool and Data for Service Scenarios |
| Analyze, Group, and Pivot Data on Lists |
| Share a Data Analysis With a Co-worker |
| Synchronize Multiple Business Central Companies With the Same Dataverse Environment |
| New Operational Limits on Scheduled Tasks and Web Requests Improve Throughput |
| Service-to-Service Apps and Device License Users Can Schedule Tasks |
| Mark Fields as Read-only When Customizing UI |
| Scan barcodes with Business Central mobile app for iOS and Android |
| Access Worksheet Pages From Mobile Phones |
| Use Virtual Tables to Expose More Business Central Data in Dataverse |
| Reverse a Customer and Vendor Ledger Entry with a Realized Gain or Loss Entry |
| Use General Ledger Account Revaluation for More Accurate Financial Statements |
| Use Standard Terminology for Project Management |
| Use Currencies When Posting Employee Transactions |
| Chat with Copilot |
| Improved Data Upgrade Troubleshooting for Dynamics GP Migration |
| Retain Permissions When Enabling Cloud Migration |
| Detect Invalid Cloud Migration Configurations with Proactive Warnings |
| Multiple VAT Numbers per Customer |
If there is a topic which fits the typical ones of this site, which you would like to see me write about, please use the form, below, to submit your idea.


1 thought on “New Functionality In Microsoft Dynamics 365 Business Central 2023 Wave 2: Analyze, Group, and Pivot Data on Lists”