 In our most recent webinar here at MADIC dynamics, we took a look at Reporting with Business Central.
If you want to catch up on this webinar, you can do so here.
- Introduction
- List Pages
- Standard Reports
- Financial Accounting
- Jet Reports
- Jet Analytics
- Power BI
- 3rd Party BI
- Conclusion
Introduction ^
In this webinar we took an introductory look at the reporting tools which come with Microsoft Dynamics 365 Business Central as standard, such as list pages, standard reports and financial reporting, as well as then taking a look at the commonly used third-party reporting tools which include Jet Reports and Power BI.
List Pages ^
I think that list pages are an overlooked feature when it comes to reporting on data in Business Central. All users know about them as they are the main place to see a list of items, customers or other master record, but many people don’t seem to look beyond this at the ability to search and filter.
Filters
As well as the basic filtering, there is also some advanced filtering which is available on the list pages.
In addition, you can also use the list pages to create reports, such as a Goods Received Not Invoiced report from the Item Ledger Entries list page:
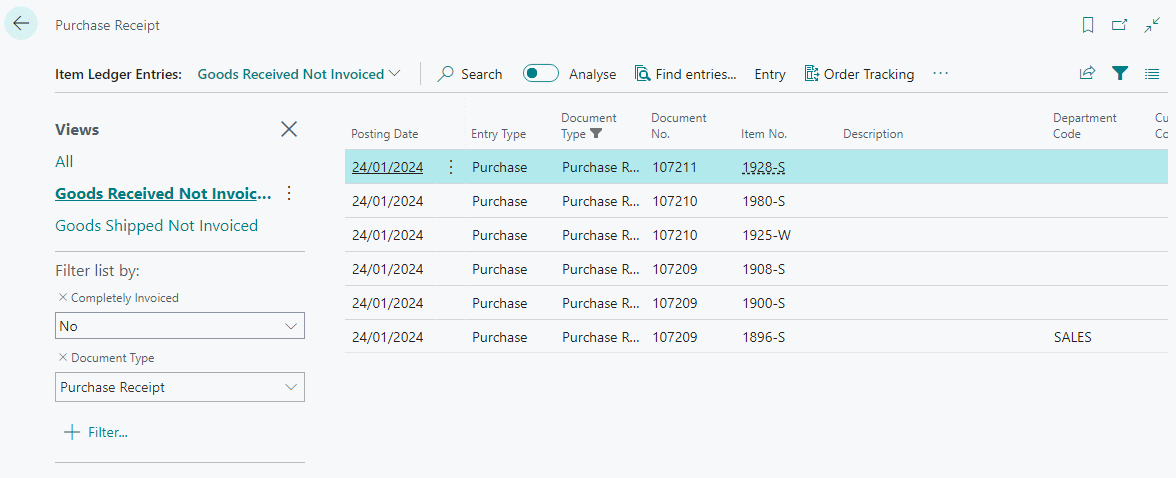
You can also created a Shipped Not Invoiced report to accompany the GRNI.
When you save a list with filters, this is saved only for you, but you can click a button and share the URL with another user which allows them to open the URL and view the list with the same filters as you had configured.
There is also the ability to export the data out to Excel with only a couple of mouse clicks, meaning you can share a spreadsheet of data with someone or take a snapshot at a point in time.
Analyze
List pages have also been enhanced in recent versions to allow users to analyze, group, and pivot data on list pages using multiple tabs:
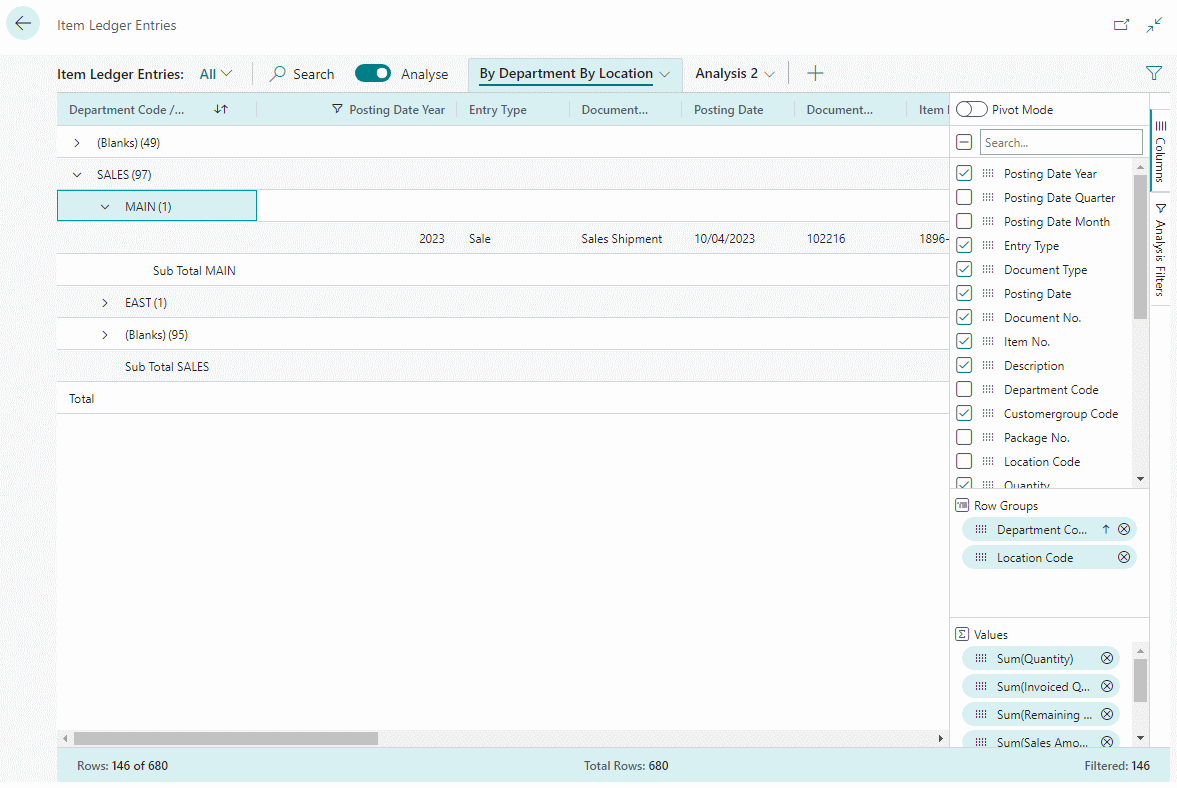
You can have multiple analyse tabs and can rename them so you can tell at a glance what a tab is for. You can duplicate tabs so you can configure one analysis and then duplicate to tweak, perhaps for another location or dimension code; you can also share a URL for the analysis which allows you to share the tab with someone else.
I’ve been quite impressed with the analyse function once I had time to take a proper look at it.
Standard Reports ^
There are a number of standard reports in Business Central, covering all modules. These reports cab be quite good and there are some I would always recommend to clients (Inventory Valuation, Aged Accounts Payables, Aged Accounts Receivables for example), but if a change large than moving something around is required, then this change needs to be made by a developer. So while they can be quite good and are quick t run, they aren’t the easiest or quickest reports to change.
Financial Accounting ^
Financial Reporting used to be called Account Schedules and is the standard way of producing financial reporting from the General Ledger; you can use this tool to create balance sheets, income statements and so on. The default set of reports it ships with can be used, but you must first update the chart of accounts the row definitions are referencing with your own, as it points, by default, to the sample chart of accounts.
I find this tool quite limiting and usually recommend using Jet Reports instead as it is much more flexible and user friendly.
Jet Reports ^
If you’ve been reading this site for a while, or have dealt with me professionally, you will know that I am a big fan of Jet Reports. It allows end users to quickly and, reasonably, easily create both financial and operational reports without the need for a developer.
Jet Reports allows you to create a report from any table in Business Central whether it is a standard or third part extension one; you can create reports which pull data from either one or multiple companies and from one or multiple environments.
It is very flexible, allowing reports to be built in many different ways depending on need, including as tables with a connected PivotTable.
I showed a few of the sample reports which are freely available from insight software as well as a couple of the ones I created as part of the book I wrote on Jet Reports with Microsoft Dynamics 365 Business Central.

The book is structured into these chapters
- Chapter 1, Introduction to Jet Reports, introduces Jet Reports and explains what type of reporting for which it can be used.
- Chapter 2, Implementing Jet Reports, covers the installation of Jet Reports including the Jet Service Tier and Jet Hub.
- Chapter 3, Configuring Jet Reports, shows how to configure Jet Reports once it has been installed.
- Chapter 4, Introducing the Excel Add-in, introduces the Excel Add-in and the features available.
- Chapter 5, Report Structure, shows how reports can be structured to make maintaining them easier.
- Chapter 6, Using the functions in the Excel Add-in, shows how each of the four Jet Functions can be used.
- Chapter 7, Creating and using an Options page, covers the creation and use of an options page in reports.
- Chapter 8, Create a Summary Trial Balance, steps through the creation of a Summary Trial Balance report.
- Chapter 9, Create a Detailed Trial Balance, shows how to make the Summary TB from the previous chapter into a Detailed report.
- Chapter 10, Create a Balance Sheet, covers the creation of a formatted Balance Sheet.
- Chapter 11, Create an Income Statement, covers the creation of an Income Statement and how to make it an intercompany/consolidated version.
- Chapter 12, Create a Summary Payables Aged Trial Balance, shows how to create a Summary Payables Trial Balance report.
- Chapter 13, Create a Sales Invoice by Customer Report, covers the creation of an operational report on sales invoices.
- Chapter 14, Report Creation Tools, introduces the tools which can be used to make creating reports easier.
- Chapter 15, Using Jet Hub, shows how users can access Jet Reports via web access and without a local install of Jet Reports.
- Chapter 16, Report Distribution, shows how users can schedule or generate reports into Microsoft Word.
The book is available as an eBook direct from my azurecurve Publishing site or from Amazon (for $5 more) in paperback or Kindle formats:
Jet Analytics ^
We just touched on Jet Analytics, discussing how it is good for users who either have a large system and want to offload report processing from their Business Central databases, where they have a large system and want to summarise data in a data warehouse or where there is data to be brought together from a variety of business systems, whether related to Business Central or not.
In terms of Business Central data, Jet Analytics, like Jet Reports, can access all Business Central data.
Jet Analytics is not a reporting tool, it is a Business Intelligence tool which is used to compile and structure data for consumption with other tools, either from the data warehouse tables or OLAP cubes which it can create. You would then use a tool like Jet Reports, Power BI or other reporting/BI tool to build the reports from the data in Jet Analytics.
Power BI ^
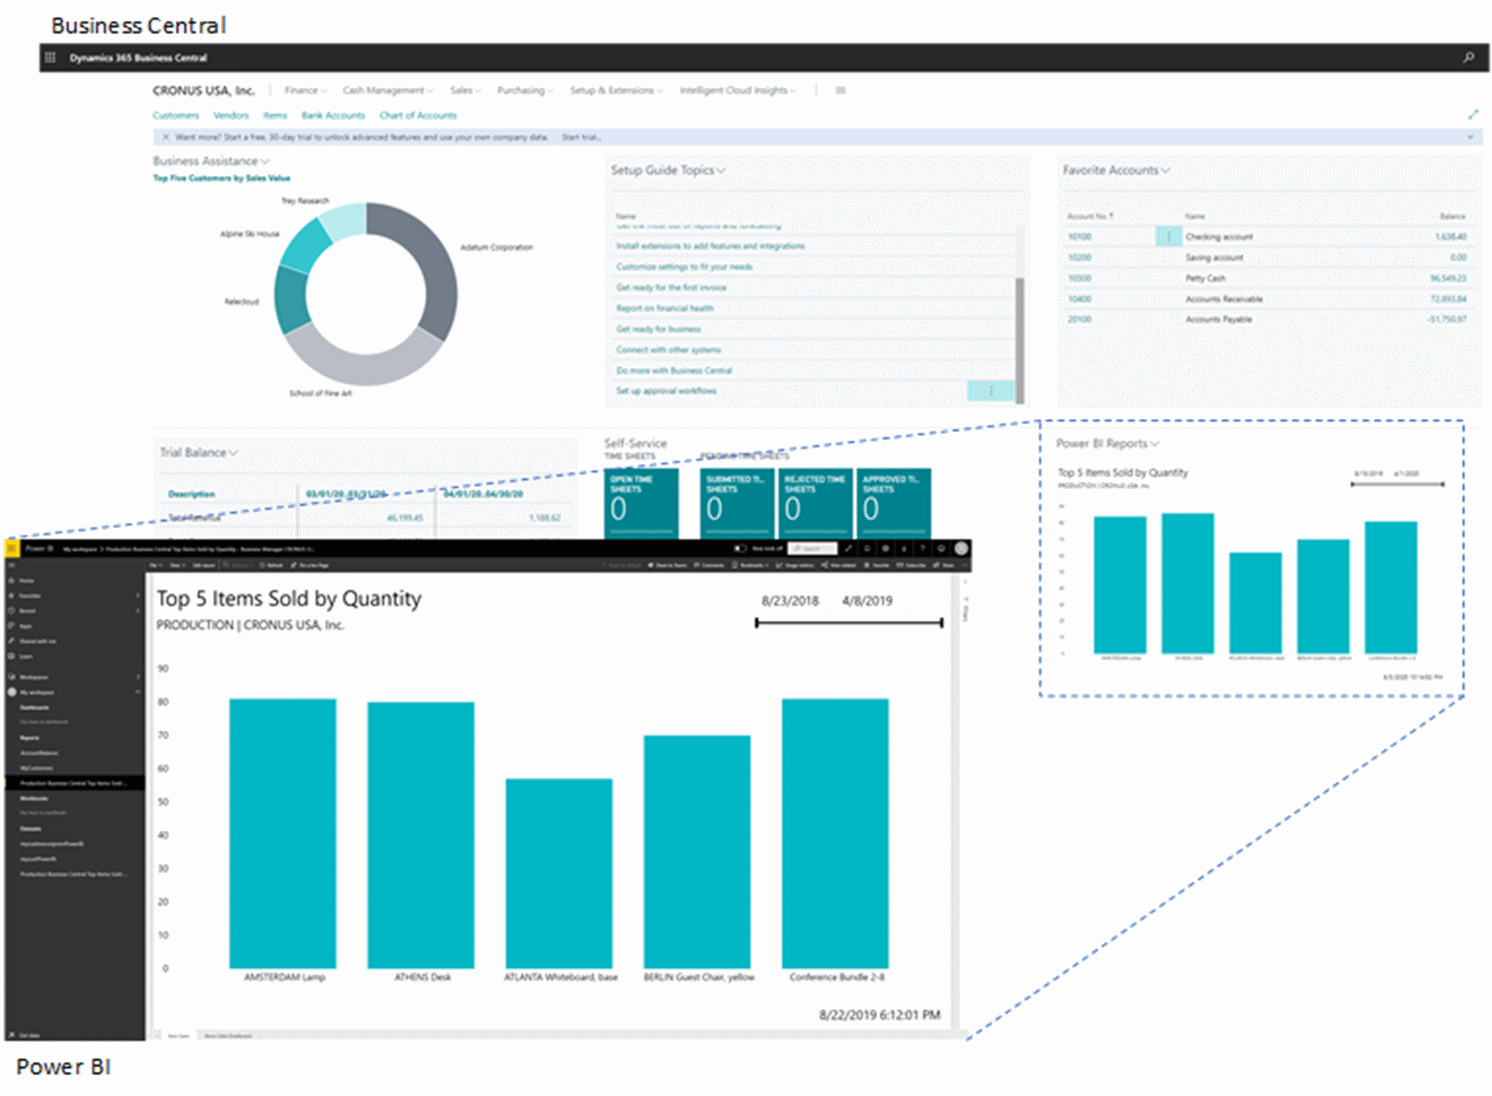
As Power BI is another product from Microsoft, like Business Central itself, it integrates tightly with Business Central, including having a section on the role centre which allows you to choose which of your Power BI reports you want to consume within Business Central.
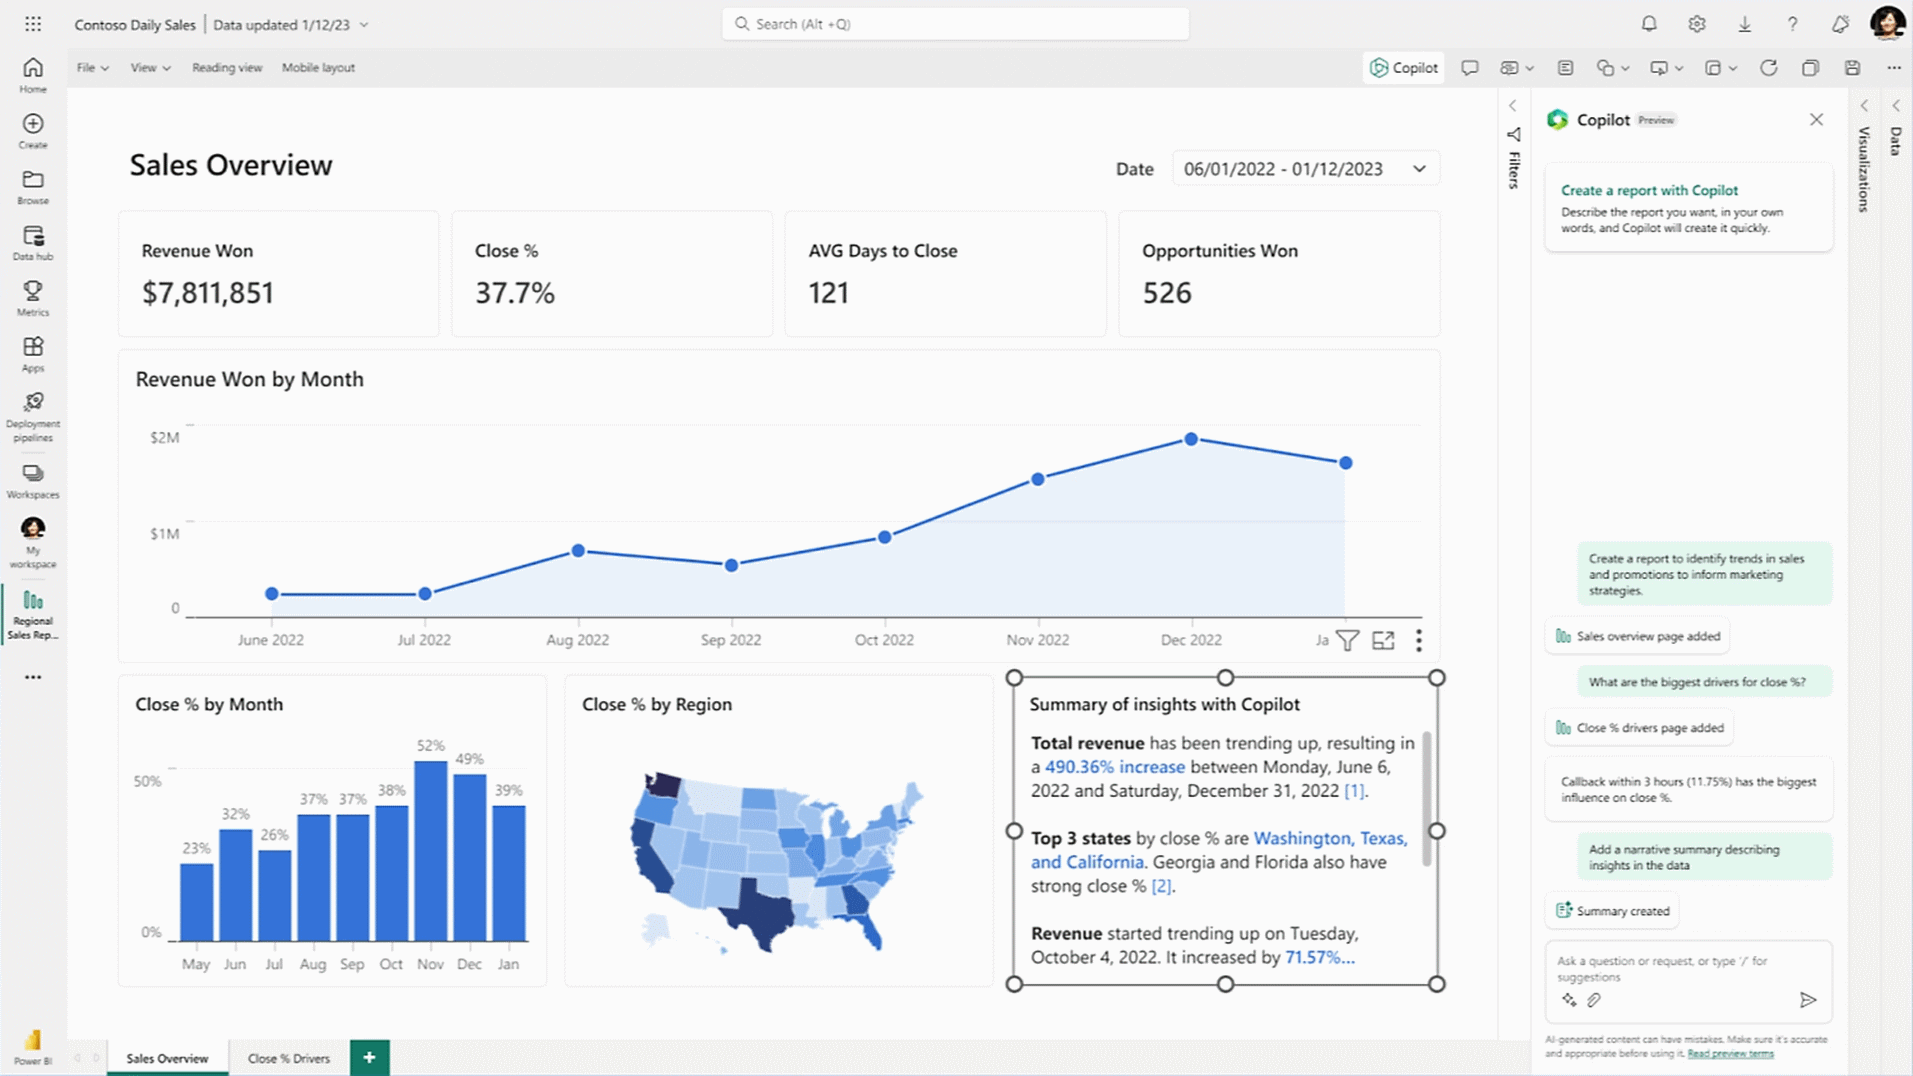
Once connected, Power BI allows users to quickly create reports and dashboards, using natural language and recent updates have embedded CoPilot for use in report creation.
3rd party BI ^
3rd party BI solutions can be connected with Business Central by using the web services, meaning you can use almost any BI solution for your reporting from Business Central.
Conclusion ^
Over the webinar, I tried to show the strengths of each product, showing that they can each target a different need. One of the questions I have been asked repeatedly over the years, is which reporting tool should be used.
Well, I tend to use a hackneyed paraphrase of a well-known quote from a book/movie in answer; there is no one reporting tool to rule them all. They each have strengths and weaknesses and the one which is best for one type of report may be unsuitable for another, so the reporting tool to use will change depending on the requirement.
That said, a lot of the time I do revert back to Jet Reports as it is probably the most flexible and easiest to learn while still allowing complex reports to be built.
One of the key points for any report building or BI tool is being able to find where the data is located; this was part of why I created the Microsoft Dynamics 365 Business Central Table Reference website.
You can watch a recording of the webinar here.
Click to show/hide the MADIC dynamics Knowledge Hub Webinars Series Index
| MADIC dynamics Knowledge Hub Webinars |
|---|
| Reporting with Business Central |
| Extending Business Central with Power Automate |
| Jet Reports & Business Central |
What should we write about next?
If there is a topic which fits the typical ones of this site, which you would like to see me write about, please use the form, below, to submit your idea.

